A couple of days ago, following up on Sunday's post about literally, Michael Ramscar sent me this fascinating graph:
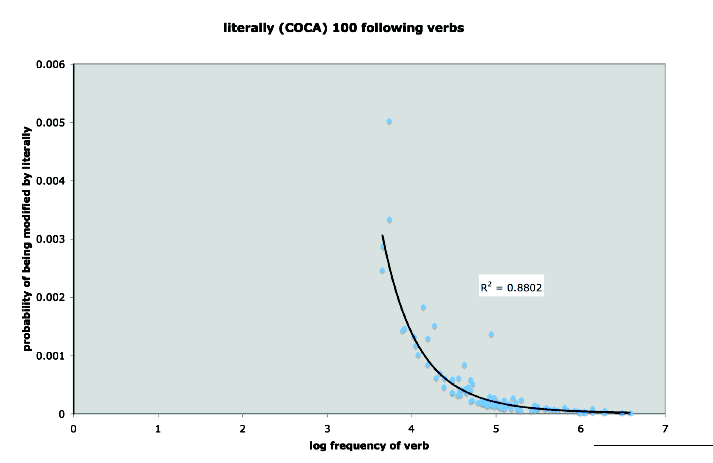
What this shows us is a remarkably lawful relationship between the frequency of a verb and the probability of its being modified by literally, as revealed by counts from the 410-million-word COCA corpus. (The R2 value means that a verb's frequency accounts for 88% of the variance in its chances of being modified by literally.)
In order to persuade himself that this is not just some "weird property of small samples of language", Michael tried the same set of verbs with definitely:
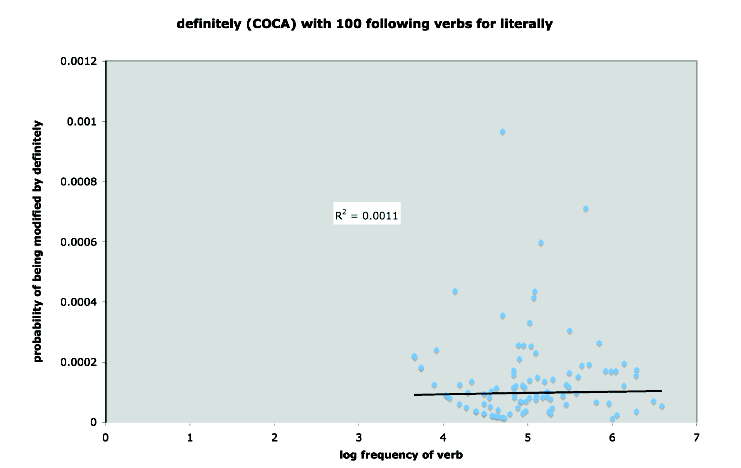
As you can see, there's no sign of a similar relationship in this case — the shape of the empirical relationship is entirely different, and only 0.1% of the variance is accounted for.
Michael's accompanying note starts this way:
The graph that shows "the change in the verb's entropy conditional on literally" is here:
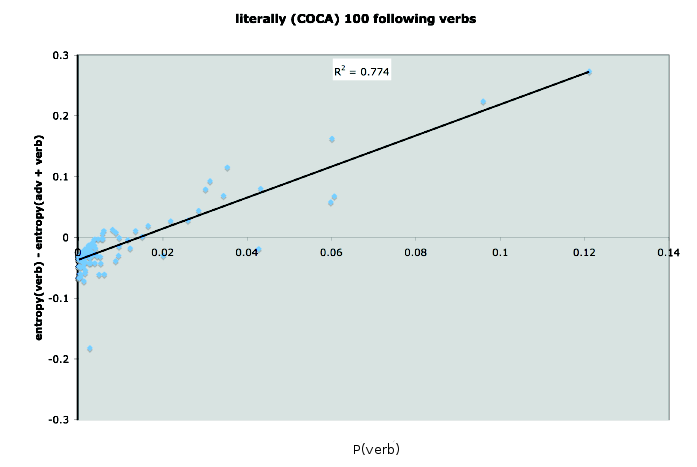
(Michael's graph labelled the x-axis as "p(noun)", which I'm pretty sure was a typo or something left over from another plot… apologies if I've misunderstood something.)
In a comment on Sunday's post, Dominik Lukeš linked to a post at Metaphor Hacker where he reports some other relevant corpus data about literally, "suggest[ing] that 'literally' is often associated with scalar concepts and therefore [functions] as both a potential trigger and disambiguator of hyperbole". Specifically, he notes that the top ten nouns immediately following literally (in COCA) are almost all quantificational:
The spreadsheets that he sent are here and here and here. Some resulting plots are here.
Update #2 — I think that Steve Kass is on to something about where the patterns come from, although I think the patterns themselves retain considerable interest. In order to check out his idea, I generated and plotted some fake data using this R script. The basic idea is to take a random sample of NTOKENS tokens from NTYPES types, assuming a 1/F probability distribution, and then to modify some of these randomly, by assuming an independent 1/F distribution of conditional probability of modification. We can then plot the log empirical frequency of types against the empirical probability of modification: the overall pattern shows a (noisy and quantized) version of the underlying distribution, and if we plot only the most-often-modified end of the list, we see the overall shape pretty well:
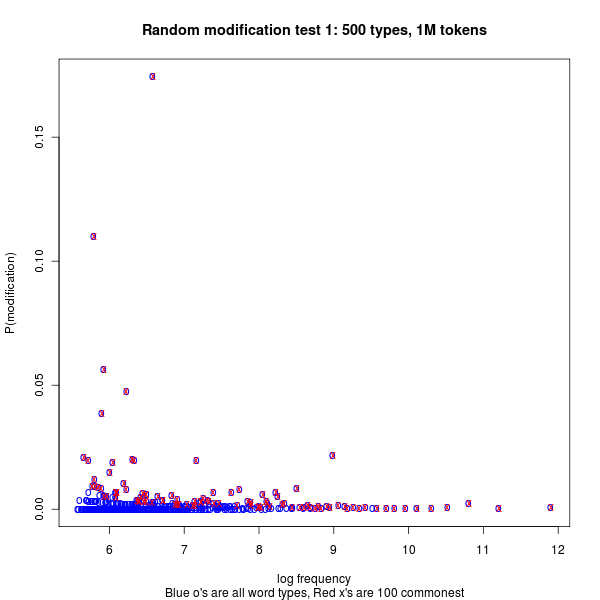
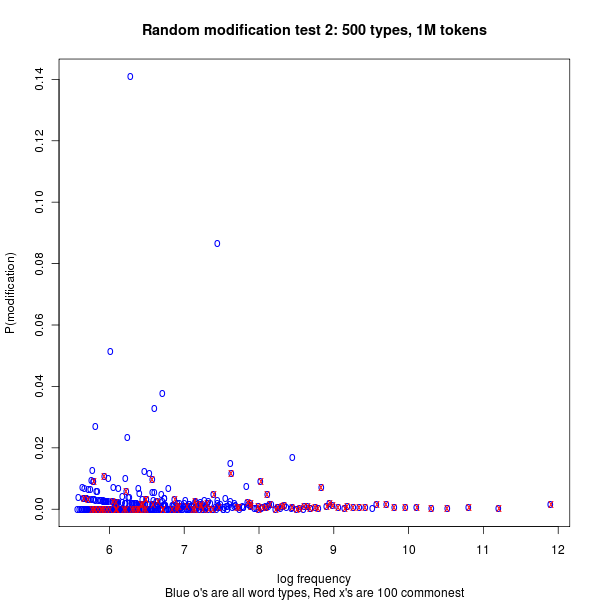
If show log frequency against empirical modification probability for counts derived from a second, independent probability-of-modification distribution, we see the same pattern overall, but the top of the list (being less fully determined by the things that determine the y-axis data) tends to sample the flatter part of the distribution:
It's possible that simulations more accurately reflecting the background facts of the COCA corpus would reproduce Michael's findings more exactly. But it's also possible that the patterns he saw deviate from these expectations — and in any case, his ruminations might apply even if the observed patterns are statistically necessary rather than linguistically contingent.

What this shows us is a remarkably lawful relationship between the frequency of a verb and the probability of its being modified by literally, as revealed by counts from the 410-million-word COCA corpus. (The R2 value means that a verb's frequency accounts for 88% of the variance in its chances of being modified by literally.)
In order to persuade himself that this is not just some "weird property of small samples of language", Michael tried the same set of verbs with definitely:

As you can see, there's no sign of a similar relationship in this case — the shape of the empirical relationship is entirely different, and only 0.1% of the variance is accounted for.
Michael's accompanying note starts this way:
A couple of years ago I was playing around with the idea that representation had a cost — you couldn't learn to discriminate something efficiently without losing a certain sense of veridicality at the same time. I suspect that the loss of sensitivity to L2 phonological categories is a natural consequence of this (as is the loss of "perfect pitch").
I began to think in the end that it was probably just the analog of physical principles of conservation (and that the only reason it wasn't obvious was because cognitive science is all about free lunches). — which is a long winded way of saying that i've been thinking more about "literally" as an intensifier, and what "intensifier" means. I think one can make sense of it in information theoretic terms. See the attached graphs, which show the probability that literally will precede a verb, plotted against the verb's log frequency, and then the change in the verb's entropy conditional on "literally."
As you can see, the way literally intensifies is to redistribute entropy. It makes lower frequency verbs more predictable (the counter-intuitive thing — because it is most "informative about highly informative verbs"), but it does this by making higher frequency verbs less predictable (the conservation bit) — which is also the part that sort of accords with normal linguistic intuitions, because in doing so, it makes higher frequency verbs more informative.
To control for the idea that this is a weird property of small samples of language, I've also plotted the distribution of the exact same set of verbs conditioned on "definitely" […] (if i wasn't needing to get on with the day, I'd do the reverse switch of definitely - literally too).
The graph that shows "the change in the verb's entropy conditional on literally" is here:

(Michael's graph labelled the x-axis as "p(noun)", which I'm pretty sure was a typo or something left over from another plot… apologies if I've misunderstood something.)
In a comment on Sunday's post, Dominik Lukeš linked to a post at Metaphor Hacker where he reports some other relevant corpus data about literally, "suggest[ing] that 'literally' is often associated with scalar concepts and therefore [functions] as both a potential trigger and disambiguator of hyperbole". Specifically, he notes that the top ten nouns immediately following literally (in COCA) are almost all quantificational:
- HUNDREDS 152
- THOUSANDS 118
- MILLIONS 55
- DOZENS 35
- BILLIONS 17
- HOURS 14
- SCORES 14
- MEANS 11
- TONS 11
- QUITE 552
- ALMOST 117
- BOTH 91
- JUST 67
- TOO 50
- SO 38
- MORE 37
- VERY 31
- SOMETIMES 30
- NOW 26
hopefully this is better than a recipe… the actual spreadsheets i used to do the analyses. there is a lot of redundancy in them because this really was a breakfast expt, and os they are a hack / re-use of some tables that i made for adjectives and nouns. i've done a quick bit of coloring to help you make sense of them. the blue columns are the raw data, and the red columns are the ones that generate the graphs.
The spreadsheets that he sent are here and here and here. Some resulting plots are here.
Update #2 — I think that Steve Kass is on to something about where the patterns come from, although I think the patterns themselves retain considerable interest. In order to check out his idea, I generated and plotted some fake data using this R script. The basic idea is to take a random sample of NTOKENS tokens from NTYPES types, assuming a 1/F probability distribution, and then to modify some of these randomly, by assuming an independent 1/F distribution of conditional probability of modification. We can then plot the log empirical frequency of types against the empirical probability of modification: the overall pattern shows a (noisy and quantized) version of the underlying distribution, and if we plot only the most-often-modified end of the list, we see the overall shape pretty well:

If show log frequency against empirical modification probability for counts derived from a second, independent probability-of-modification distribution, we see the same pattern overall, but the top of the list (being less fully determined by the things that determine the y-axis data) tends to sample the flatter part of the distribution:

It's possible that simulations more accurately reflecting the background facts of the COCA corpus would reproduce Michael's findings more exactly. But it's also possible that the patterns he saw deviate from these expectations — and in any case, his ruminations might apply even if the observed patterns are statistically necessary rather than linguistically contingent.
Source: http://languagelog.ldc.upenn.edu/nll/?p=3017
No comments:
Post a Comment